General Widgets in the Dashboard
Widgets are customizable data visualization tools that empower users to efficiently analyze and present their data, enhancing insights and reporting capabilities. This article explores the key features and benefits of general widgets available on your dashboard and provides a guide on how to use them to optimize your data analysis.
List of General Widgets

Here are some of the general widgets available:
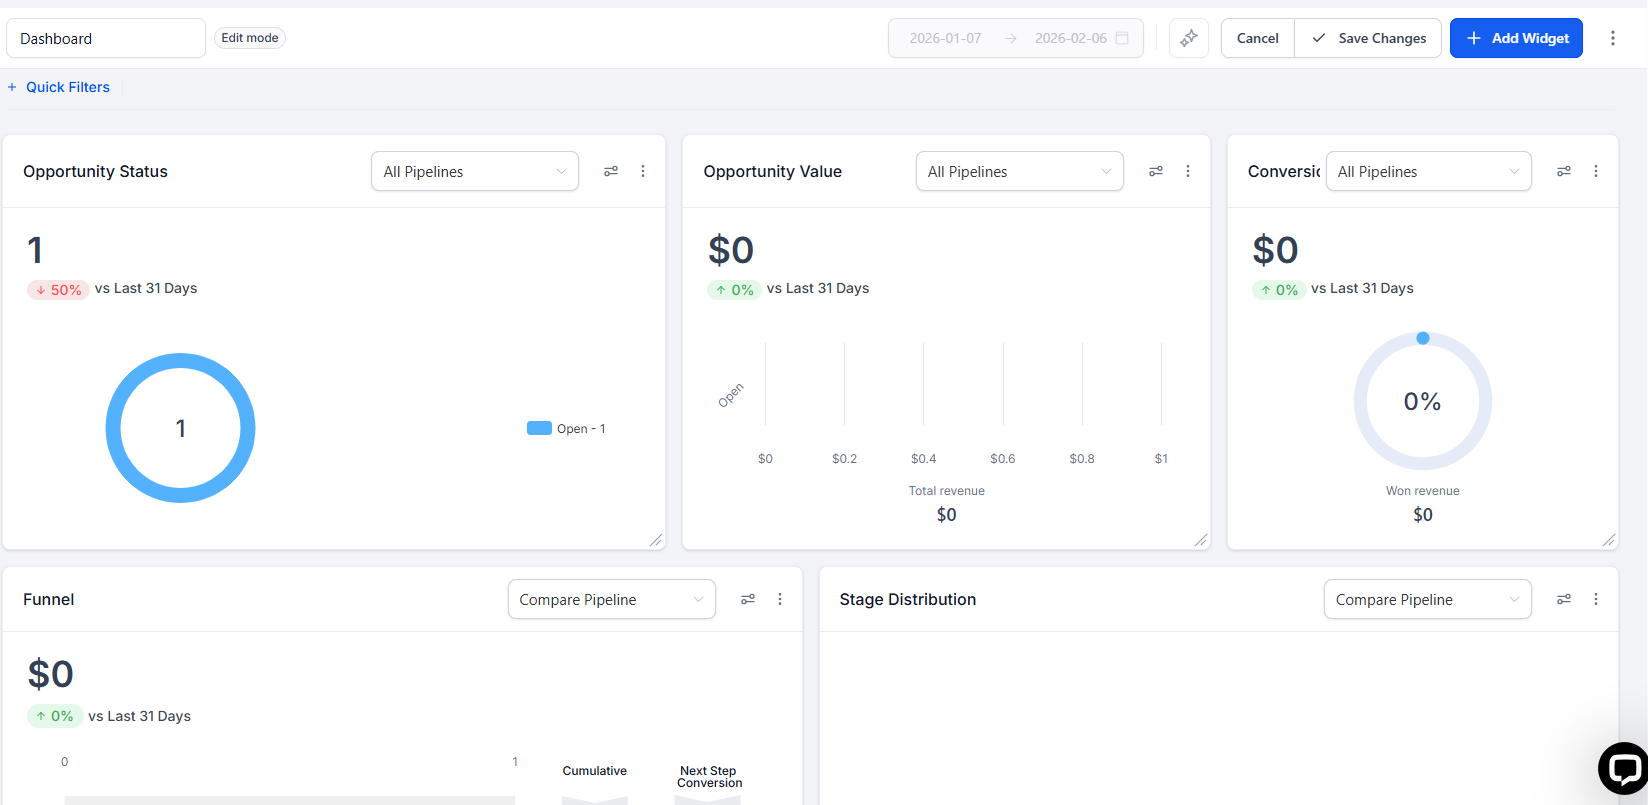
- Opportunity Status: Visualize the status of your opportunities.
- Opportunity Value: Understand the total value of opportunities, categorized by status.
- Conversion Rate: Track the conversion rate and revenue generated by won opportunities.
- Funnel: Get a detailed view of your sales funnel and conversion rates at each stage.
- Stages Distribution: Understand how opportunities are distributed among different stages.
- Tasks: Monitor all tasks added and the team member it is assigned to.
- Manual Actions: Keep track of manual actions, such as SMS and phone calls, in your campaigns.
- Lead Source Report: Get an overview of total leads by source.
- Google Analytics Count: Track the number of total views in your Google Analytics report.
- Google Analytics Chart: Get insights into the number of total views and interactions on your website.
- Google Business Profile: Monitor your Google Business Profile metrics.
- Facebook Ads Report: Keep an eye on clicks, spending, CTR, and CPC for Facebook ads.
- Google Ads Report: Track clicks, spending, CTR, and CPC for Google ads.
- Sales Efficiency: Provides key metrics such as Average Sales Duration, Total Sales Value, and Sales Velocity to help monitor and improve sales processes. Metrics can be filtered by users for detailed insights.
How to Use General Widgets
Step-by-Step Guide
- Access the Dashboard: Navigate to your dashboard where widgets are displayed.
- Add a Widget: Click on the "Add Widget" button located at the top right corner of the dashboard.
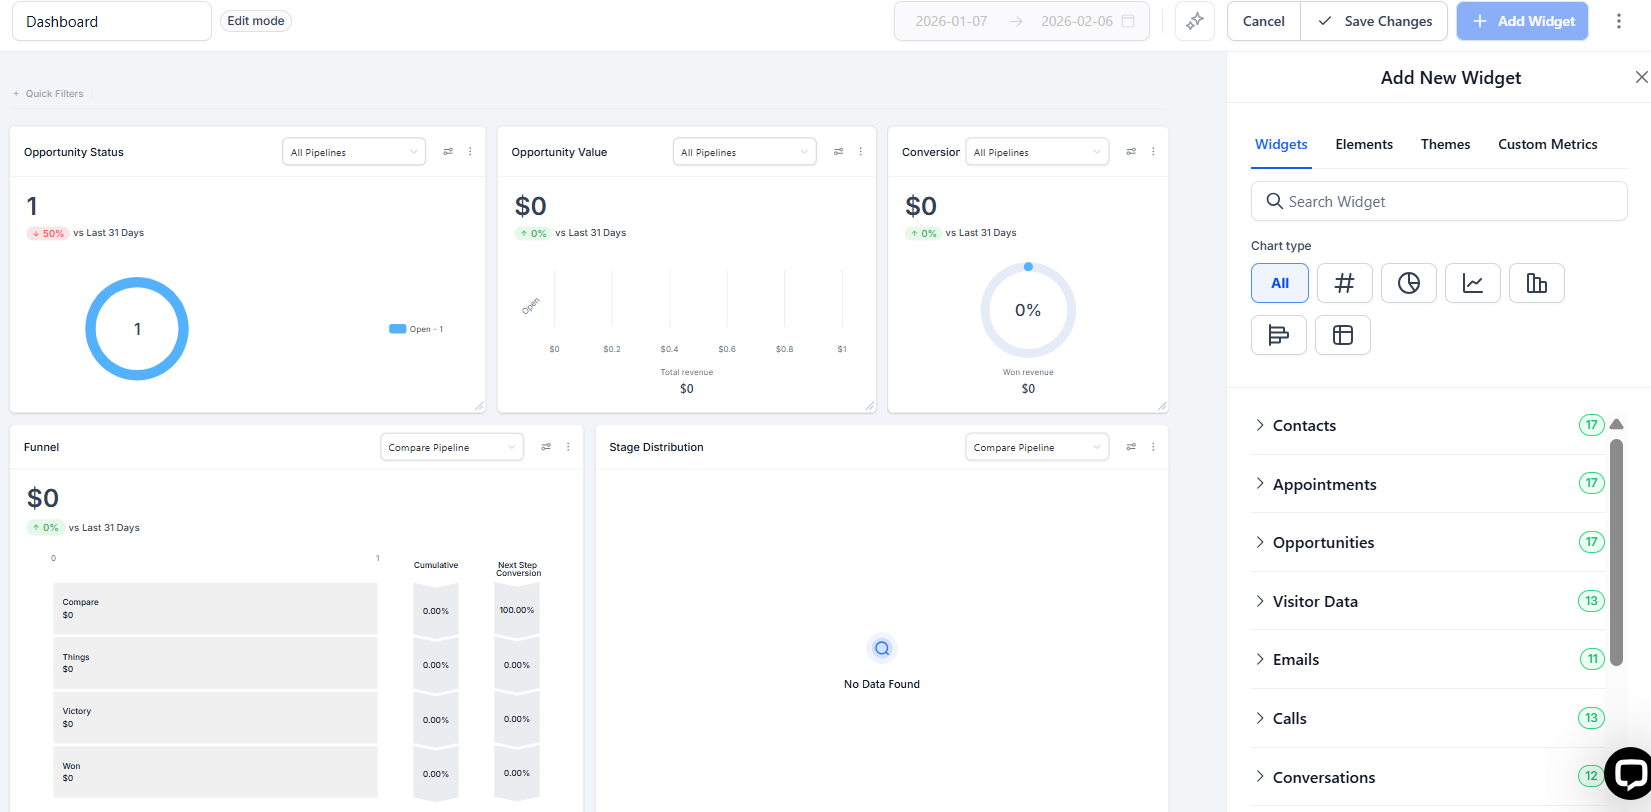
- Select a Widget: From the list of general widgets, select the widget you want to add.
- Configure (if applicable): Some widgets may have configuration options such as filters to view specific user data.
- Save and Monitor: Save the widget to your dashboard and start analyzing the data.
Benefits
- Enhanced Data Accessibility: Quickly access and visualize relevant data tailored to your business needs.
- Improved Decision-Making: Make informed decisions based on real-time data and performance metrics.
- Time Efficiency: Save time by using predefined widgets that offer essential insights without the need for customization.
Pro Tips
- Regularly Review Widgets: Regularly review and update your widgets to ensure you are always working with the most relevant data.
- Use Filters Wisely: Utilize available filters to drill down into specific data sets and gain deeper insights into performance metrics.
- Combine Widgets: Combine multiple widgets to get a comprehensive view of your business performance.
FAQ's
Question: What are general widgets?
Answer: General widgets are customizable data visualization tools that allow users to analyze, monitor, and present data on their dashboard, helping optimize insights and reporting capabilities.
Question: How do I add a widget to my dashboard?
Answer: To add a widget:
Navigate to your dashboard.
Click on the "Add Widget" button at the top right.
Select the desired widget from the list, configure any applicable filters, and save it.
Question: Can widgets be customized?
Answer: Yes, many widgets offer configuration options, such as filtering data by specific users, date ranges, or other relevant parameters, to tailor the insights to your needs.
Question: What types of widgets are available?
Answer: Some popular widgets include:
Opportunity Status
Conversion Rate
Tasks
Google Analytics Chart
Facebook Ads Report
Sales Efficiency Metrics
Refer to the full list in the article for more options.
Question: Can I combine multiple widgets for better insights?
Answer: Yes, combining widgets can provide a comprehensive view of your business performance. For example, pairing Sales Efficiency with Lead Source Report helps you correlate lead origins with sales performance.
Question: How often should I update my widgets?
Answer: Regularly review your widgets to ensure the data displayed is still relevant to your business goals. This keeps your dashboard aligned with current metrics and priorities.
Question: Are widgets updated in real-time?
Answer: Most widgets display real-time data or are updated periodically, depending on the data source. For example, Google Analytics or Facebook Ads widgets may reflect metrics with slight delays based on their respective platforms.
Question: Can I filter data within widgets to view specific metrics?
Answer: Yes, many widgets come with filter options that allow you to narrow down the data to specific criteria, such as users, date ranges, or particular performance metrics. This feature helps you analyze specific subsets of data for more targeted insights.
Question: How do I monitor sales performance with widgets?
Answer: To monitor sales performance, you can use widgets like Sales Efficiency and Opportunity Value. The Sales Efficiency widget tracks key metrics like Average Sales Duration, Total Sales Value, and Sales Velocity, allowing you to analyze sales processes. The Opportunity Value widget helps you understand the total value of opportunities, categorized by their status, offering insights into your sales pipeline.
Question: Can I move the widgets around to put the most important ones at the top?
Answer: Yes! When you are in the Edit mode of your dashboard, you can click and drag any widget to a new position. You can also resize them to make your most important charts larger and easier to read.
Question: Can I create different dashboards for different team members?
Answer: Yes. You can create multiple dashboards (e.g., a "Sales Dashboard" for reps and a "Marketing Dashboard" for ad managers). You can then use the Permissions settings to ensure users only see the dashboard relevant to their specific role.