Dashboard: Visitor Data Widgets
By customizing your dashboard, you can gain real-time insights, identify top-performing funnels, and make data-driven decisions. This guide will walk you through creating a dashboard tailored to your needs, showcasing the visitor journey from first interaction to final conversion.
Key Features and Benefits
- Real-Time Data Tracking: View metrics such as unique page views, opt-ins, and appointments in one centralized location.
- Customizable Widgets: Configure each widget to display specific data, from funnel trends to top-performing pages.
- Enhanced Client Reporting: Provide clients or team members with detailed analytics, ensuring transparency and informed decision-making.
- Improved Workflow Efficiency: Eliminate the need for manual reporting by automating data visualization on your dashboard.
How to Create and Customize Your Dashboard
Step 1: Access the Dashboard
Navigate to the dashboard section of your account. Click on "Add Dashboard" to start a new project.

Step 2: Choose a Template or Start Blank
You can:
- Select a Template: Browse pre-designed templates based on your needs.
- Start Blank: For complete customization, select the blank option and name your dashboard.

Step 3: Add Widgets for Visitor Data
- Click "Add Widget" and select the "Visitor Data" option.
- Choose metrics like:
Unique Funnel Views:
- Displays the count of unique visits to a specific funnel.

Set the Metric Type

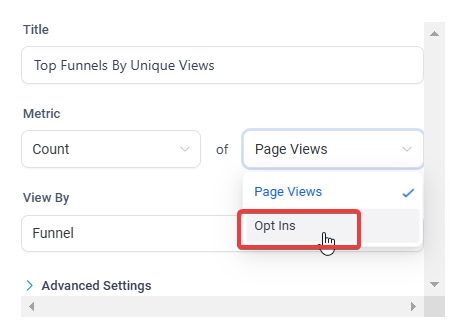
If you're interested in opt-ins, you can switch the metric to "Opt-Ins" to track conversions within the funnel. For this example, we will continue with “Page Views” only.
Customize Advanced Settings
- Access Advanced Settings in the widget configuration panel.
- Date Range Customization:
- Leave the date range to Global Settings if you want the dashboard to update dynamically based on the date range input at the top of the dashboard.
- Optionally, set a Custom Date Range if you want the widget to show data for a specific time frame (e.g., previous 31 days, Year Before etc.).

Apply Conditions to Filter Data
- Scroll to the Conditions section to refine the data shown in the widget.
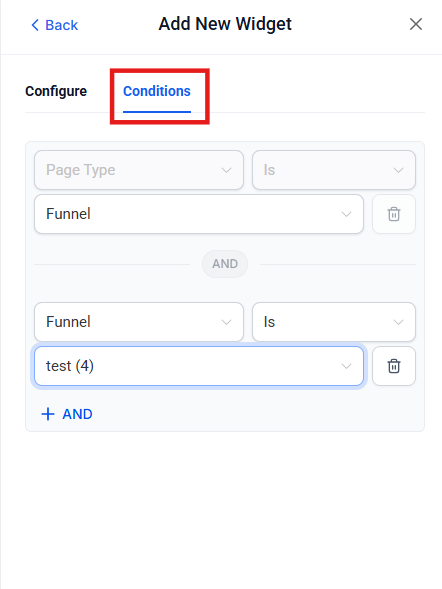
- Select Data Type:
- Choose between Funnels or Websites to specify what you want to track.
- Filter by Funnel:
- Use the dropdown menu to select the funnel you wish to track.
- Example: If you have multiple funnels, select the specific funnel that you are running ads for or want to analyze.
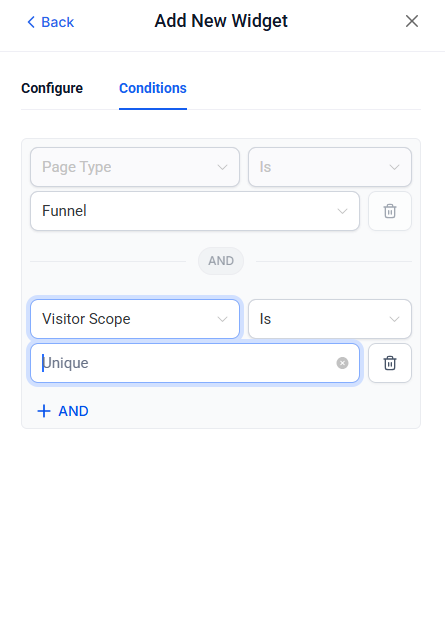
- Visitor Scope:
- For Unique Funnel Views, set Visitor Scope to "Unique".
- For Page Views, set Visitor Scope to "All".
For this example, we have chosen Unique as we are only running ads to a specific funnel.
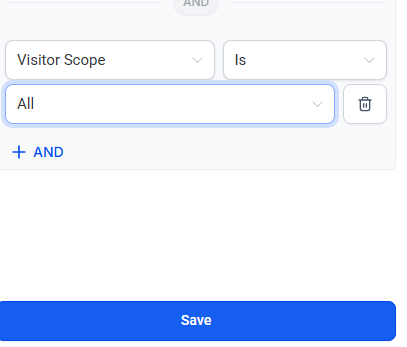
Save the Widget
- After configuring all settings, click "Save" to add the widget to your dashboard.
- Adjust the widget size and position as needed for better visibility.
Opt-Ins:
- Tracks the total number of successful opt-ins.
- Navigate to the Visitor Data section in the widget options panel.
- Scroll down to find "Total Opt-Ins" and select it.

Configure Conditions
- Select the Funnel:
- To track a funnel, click "Conditions" and select the desired funnel from the dropdown menu.
- Set Visitor Scope:
- Choose "Unique" to track unique opt-ins for the funnel.
- Choose "All" to track total opt-ins, including repeat entries.
- For this example, we have chosen Unique.

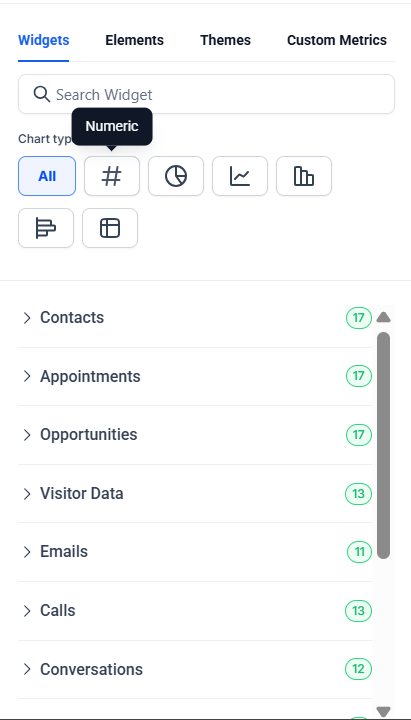
- Customize Chart Type (Optional)
At the top of the widget configuration panel, select from various Chart Types like:
- Numeric Display: Shows a single numeric value (e.g., total opt-ins).
- Line Chart: Displays opt-ins over a period, useful for observing trends.
- Bar Chart: Shows opt-ins in grouped intervals (e.g., daily, weekly).
After finalizing the configuration, click "Save" to add the widget to your dashboard.
Appointments:
- Monitors booked and confirmed appointments.
Select Appointment Data
- In the widget configuration panel, navigate to "Appointments" from the available data options.
- Choose the "Appointment Count" metric to track the total number of appointments across your selected criteria.

Configure Conditions
- Add Conditions (Optional):
- If you want to filter appointments based on specific attributes:
- Click on "Conditions" in the widget settings.
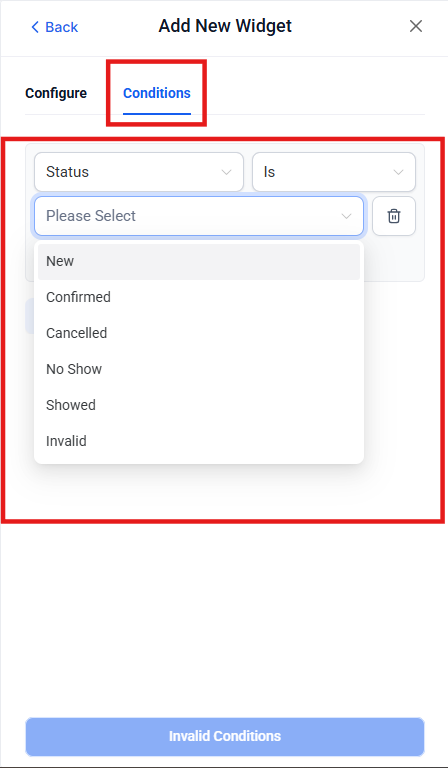
- Add filters such as:
- Appointment Status: Filter appointments by their current state, such as Confirmed, Pending, No Shows, etc.
- Appointment Type: Narrow down results by specific services or calendars.
- If no specific conditions are required, you can skip this step.
- If you want to filter appointments based on specific attributes:
Analyzing Funnel Performance Using Widgets
Step 1: Add a Funnel Views Trend Widget
- Select Funnel Views Trend Data:
- Click on "Add Widget" to begin adding a new element.
- In the widget configuration panel, navigate to "Visitor Data".
- Scroll down and select "Funnel Views Trend" from the list of available options.
- Configure Metrics and Breakdown:
- Set the Metric to Unique Funnel Views to focus on individual visitors rather than total visits.
- Choose the Breakdown option:
- Daily: Displays funnel views broken down by each day.
- Weekly: Provides an aggregated weekly view for long-term trends.
- Select Daily for a more granular view of daily performance.
- Add Specific Funnel Conditions:
- Under the Conditions tab, specify which funnel you want to track:
- Select Funnel as the condition type.
- Choose the specific funnel from the dropdown menu.
- Set the Visitor Scope to Unique to focus on unique visitors.
- Click "Save" to add the widget to your dashboard.
- Under the Conditions tab, specify which funnel you want to track:

Step 2: Add a Top Funnel by Unique Views Widget
- Start Adding a New Widget:
- Click on "Add Widget" and select "Visitor Data" again.
- Choose Top Funnel by Unique Views:
- Scroll through the data options and select "Top Funnel by Unique Views".

- Customize Conditions:
- Specify the funnel conditions:
- Choose Funnel as the condition type.
- If running ads, select the funnel receiving the traffic from the dropdown menu.
- Specify the funnel conditions:
- Set Visitor Scope to Unique for precise analysis.
- Choose Chart Type:
- Use the default chart type or select an alternative (e.g., bar, line, or pie chart) for better visualization.
- Click "Save" to finalize the widget.
- Adjust Widget Placement:
- Drag and position the widget next to other related widgets for easy comparison.
Step 3: Add a Top Funnel by Opt-ins
- Add a New Widget:
- Go back to "Add Widget" and choose "Visitor Data".
- Select Top Funnel by Opt-ins:
- Scroll through the list and select "Top Funnel by Unique Views" and this time choose Opt-ins to analyze which funnels are generating the most sign-ups.

- Configure Chart Type:
- Customize the chart type based on your preference (e.g., line or bar chart).
- Select a specific funnel or apply a broader filter for all funnels.
- Save the Widget:
- After configuring all settings, click "Save" and arrange the widget on the dashboard.
Step 4: Review and Finalize the Dashboard
- Validate Data and Filters:
- Ensure all widgets display accurate and relevant data for the selected funnels and date ranges.
- Test the global date range settings to confirm that widgets dynamically update based on the selected period.
- Rename Widgets for Clarity:
- Update the titles of each widget to accurately reflect the data being displayed:
- Example: "Daily Funnel Views Trend," "Top Funnel by Unique Views," or "Top Funnel by Opt-ins."
- Update the titles of each widget to accurately reflect the data being displayed:

- Save the Dashboard:
- Once all widgets are added and configured, click "Save" to finalize your dashboard.
- Test Dynamic Updates:
- Change the global date range to test how the widgets respond.
- Validate that comparisons and trends update dynamically.
Pro Tips
- Track Specific Funnels: Use conditions to narrow down data for individual funnels, ensuring targeted insights.
- Use Comparisons: Enable comparisons with previous periods to monitor performance trends effectively.
- Adjust Widget Titles: Rename widgets for clarity, like “Total Confirmed Appointments” or “Top Performing Funnels.”
- Enable Client Access: If you manage clients, share dashboards to provide them with real-time insights.
- Experiment with Visuals: Use different chart types to present data in an easy-to-digest format.
FAQs
Question: Can I track data for both funnels and websites on the same dashboard?
Answer: Yes, you can add separate widgets for funnels and websites and customize them independently.
Question: How do I track only confirmed appointments?
Answer: In the widget configuration, apply a condition to filter by appointment status and select “Confirmed.”
Question: Can I share dashboards with clients?
Answer: Yes, dashboards can be shared with clients to provide them with real-time insights into their campaigns.
Question: What is the difference between unique views and total views?
Answer: Unique views count each visitor once, regardless of how many times they visit. Total views include all visits, even repeated ones.
Question: How can I track performance over time?
Answer: Enable the "Trend" widget to view metrics like funnel views or opt-ins over specific timeframes (daily, weekly, monthly).
Question: Can I customize widgets after adding them to a dashboard?
Answer: Yes, widgets can be adjusted, resized, or updated with new filters, metrics, or chart types even after they have been added.
Question: How do I track specific funnels in my dashboard?
Answer: You can track specific funnels by adding conditions to your widgets. In the widget settings, you can choose the specific funnel you want to analyze from a dropdown menu, ensuring the data displayed is focused on that particular funnel.
Question: Can I export a widget's chart as an image for a presentation?
Answer: While you cannot export individual widgets as images directly, you can use the "Print/Export to PDF" feature of the dashboard to create a professional report. Alternatively, sharing the dashboard link with a client allows them to view the live, interactive charts.
Question: Can I set a specific widget to always show "Last 7 Days" regardless of the Global Dashboard filter?
Answer: Yes. In the Advanced Settings of any widget, you can override the "Global Settings" by choosing a "Custom Date Range." This is perfect for "Leaderboard" widgets where you always want to see the most recent performance at a glance.